Service Information
Architecture
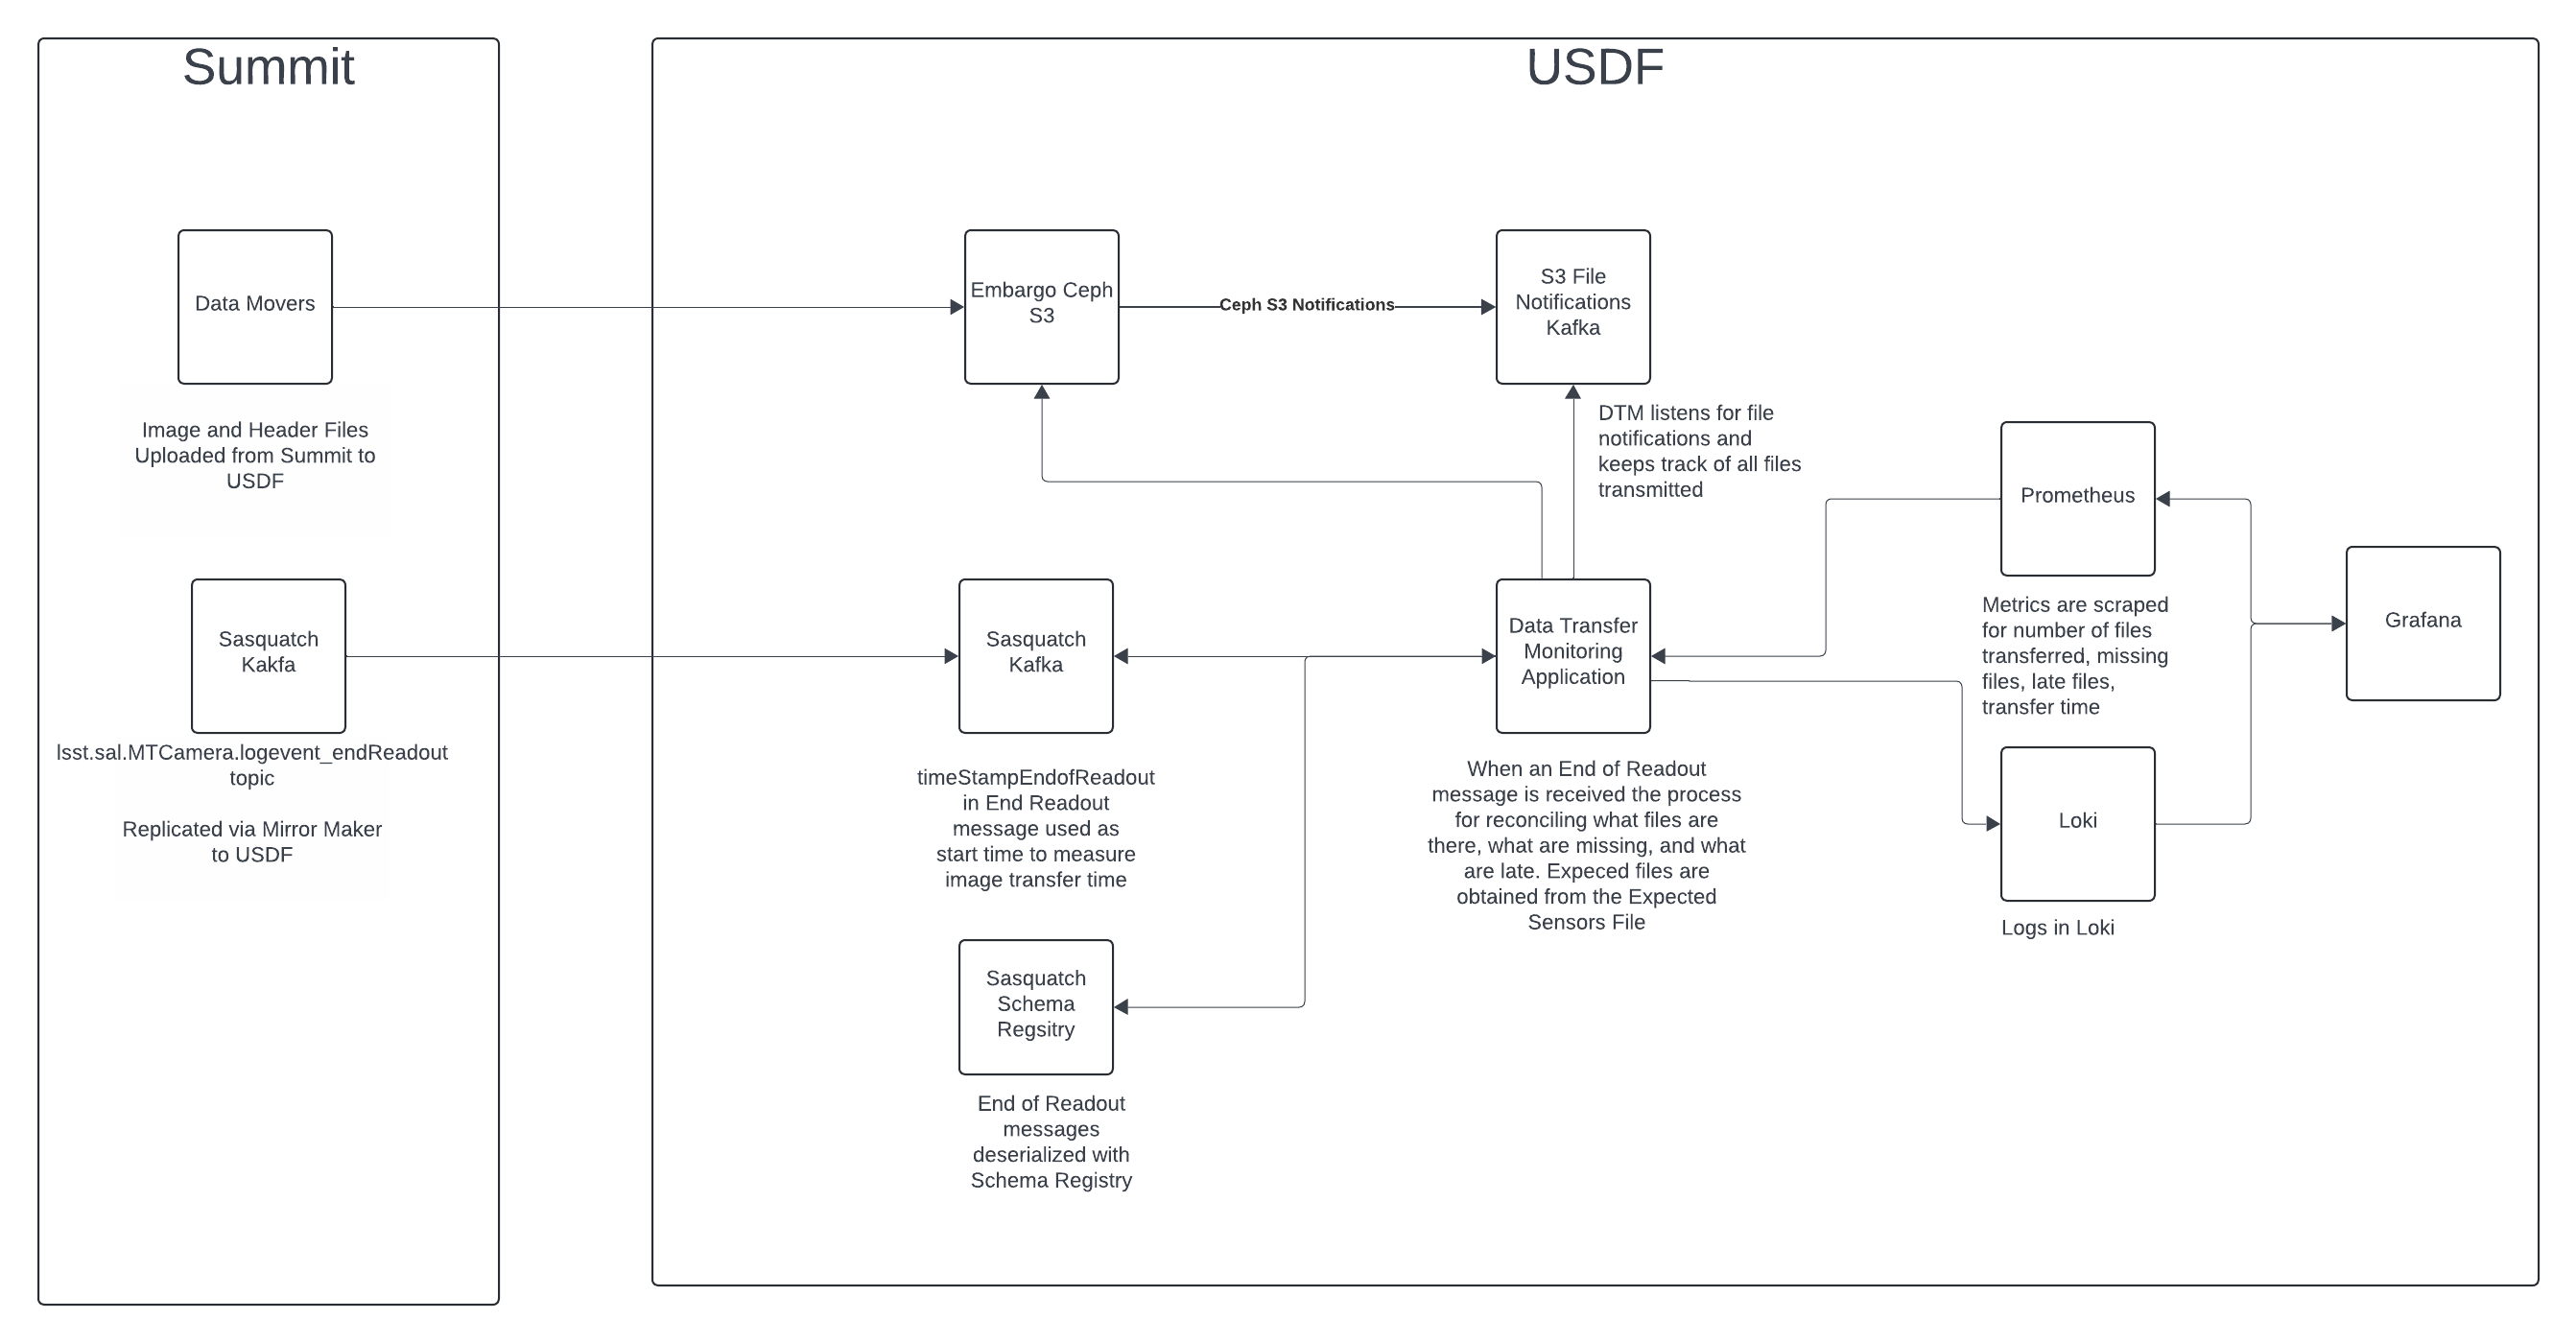
Data Transfer Monitoring is an asynchronous Python application to monitor file transfer notifications, end readout messages, and calculate transfer times of exposures to the USDF.
A day label is generated for the Observing Day and is added to the Prometheus metrics to allow for filtering by Observation Day in the Grafana.
Below is a breakdown of the Prometheus metrics used in the End to End Grafana Dashboard.
File Transfers
The Data Movers at the Summit sends files to the USDF Embargo Ceph cluster. Bucket Notifications for Objects Created on the rubin-summit bucket in the USDF are sent to the S3 File Notifications Kafka cluster. Data Transfer Monitoring connects to the S3 File Notifications Kafka cluster to listen for the file notifications. Data Transfer Monitoring (DTM) has a counter metric called dtm_file_messages_received_total to calculate the amount of files created. Note that there can be duplicate file notifications for files that are resent.
Transfer Time
The Camera creates End Readout Kafka messages which includes a timestampEndOfReadout field. This message is read by DTM to determine when to start the timer for calculating how long an exposure takes to transfer to the USDF. An asynchronous task is generated in Data Transfer Monitoring for each end of readout message. The tasks sleeps for 30 seconds waiting for the files to arrive. The last file that arrives during this window is used to calculate the end time for the exposure transfer. The transfer time is published in the dtm_s3_transfer_duration_seconds_bucket as a histogram Prometheus metric. Histogram buckets are defined here. Transfer times are reported at the bucket level. For example there are two buckets, 20 and 25 seconds. If transfer time is 22 seconds it will be reported at 25 seconds. The bucket values can be adjusted if the actual time of transfers does not match the profile of time break outs in the buckets. In the dashboards the histogram__quantile Grafana/Prometheus function is used to calculate percentile and median values. For example for the 98th percentile this function is used histogram_quantile(0.98, sum by(le,app) (rate(dtm_s3_transfer_duration_seconds_bucket[$__rate_interval])))
Transfer times are not tracked if it took more than 30 seconds. These files will be marked as late files. To increase the threshold to monitor transfers for a longer period adjust the S3_WAIT_TIME variable in DTM.
Late Files
Expected files to arrive are tracked based on the contents of the Expected Sensors file. The late file threshold is set at 10 seconds. The async tasks spawned by Data Transfer Monitoring will sleep for 30 seconds and then check for any late files. This setting is configurable by changing the MAX_LATE_FILE_TIME variable. Files with transfer times over 30 seconds will not be identified. When late files are identified the dtm_s3_late_or_missing_total Prometheus counter is incremented.
Network
The dashboards in the End to End Dashboard network row calculates the amount of times outs reported by the Socat Proxies that connect to the Summit. A filter for Operation timed out logs is used to identify logs and the dashboard reports the quantity of times reported.
Architecture Diagram
Associated Systems
File notifications are from the S3 File Notifications Kafka Cluster. The file notifications are created by the USDF Embargo Ceph Cluster. File timestamps are read from the Embargo Ceph S3 cluster. End Read Kafka messages are from USDF Sasquatch cluster. Metrics for file counts, transfer times, and late files are scraped by the S3DF Prometheus. Logs for file timing and late files are captured by Loki. Visualizations of Metrics are provided by the S3DF Grafana.
Configuration Location
Config Area |
Location |
|---|---|
Configuration |
|
Vault Secrets Dev |
N/A |
Vault Secrets Prod |
secret/rubin/usdf-embargo-dmz/dtm |
Data Flow
See Architecture
Dependencies - S3DF
S3 File Notification Kafka Cluster
Embargo Ceph S3 Cluster
USDF Sasquatch Kafka
S3DF Prometheus
S3DF Loki
S3DF Grafana
Dependencies - External
Connectivity to the Summit is needed to receive End Readout messages and files to monitor.
Disaster Recovery
In a Disaster Recovery event the service can be redeployed. No data restoration is needed.